
Documentation
RESPECT
How to turn a pentest report into checks replayed automatically, and get warned the moment a fix stops holding.
Concepts
RESPECT organises work around five objects. Understanding them is enough to use the product.
| Object | What it is |
|---|---|
| Tenant | An organisation. Isolates everything else: two tenants never see each other's data. |
| Scope | An assessment perimeter, usually one audit or one application. This is the unit you schedule and measure. |
| Asset | A concrete target inside that perimeter: a host, an endpoint, a domain. |
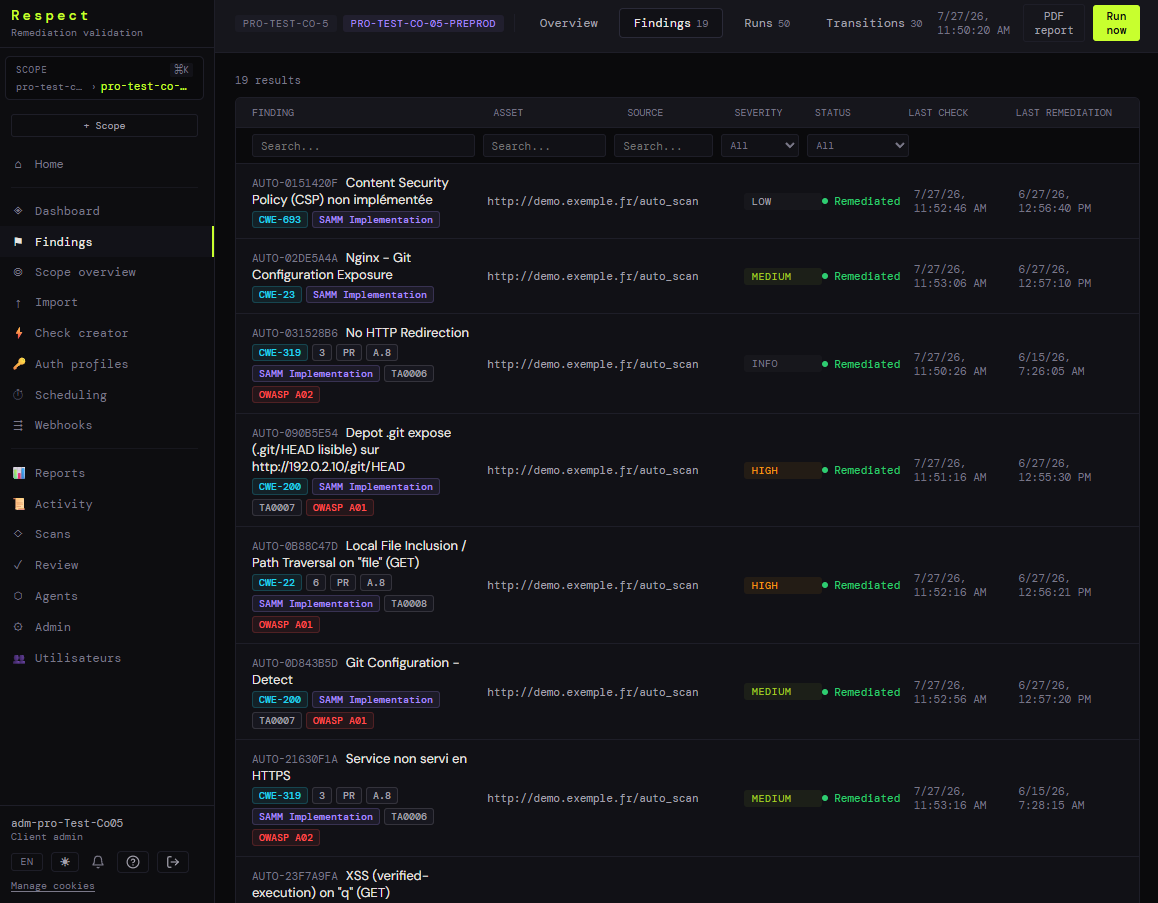
| Finding | A vulnerability from your pentest report. Carries a reference, a title, a severity and a state. |
| Check | The reproducible test attached to a finding. It decides whether the fix still holds. |
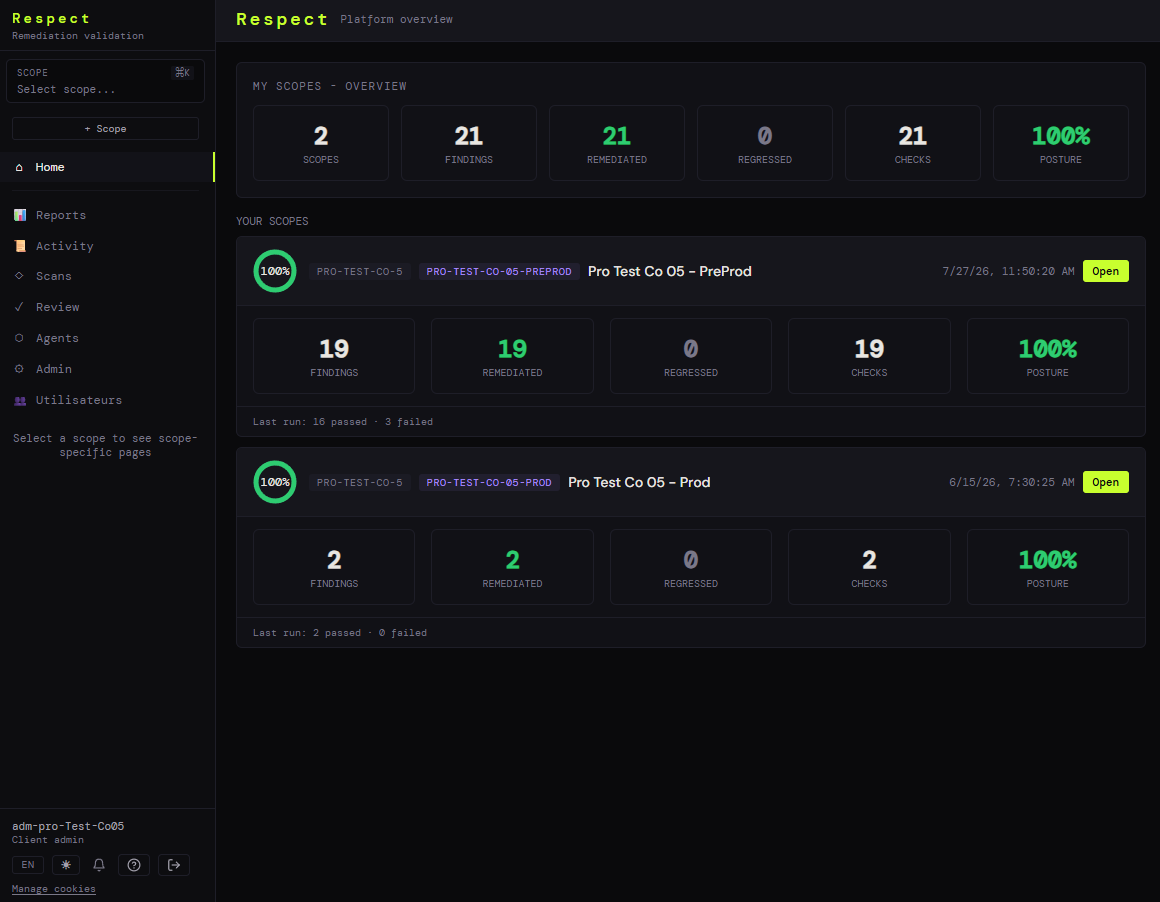
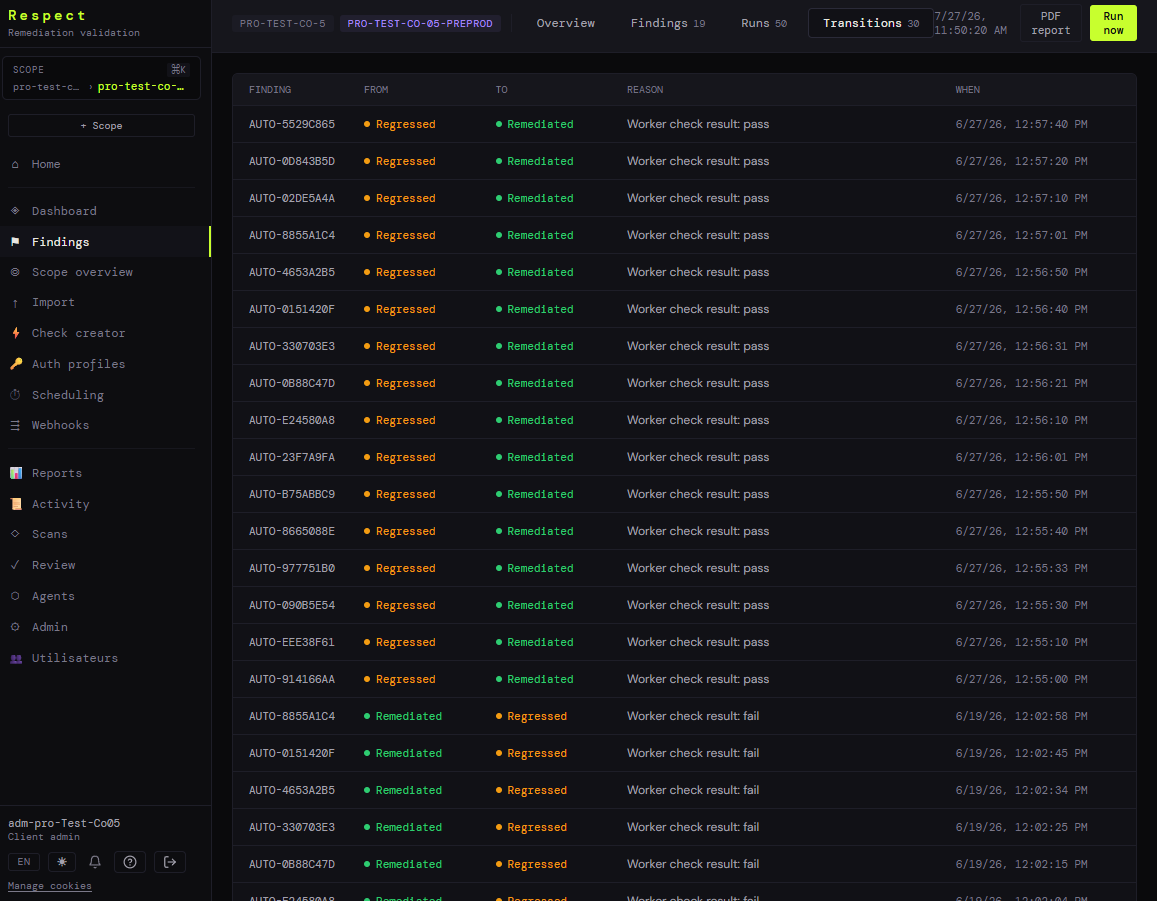
A validation run executes every check in a scope and updates each finding's state. Every state change is recorded as a transition.
Finding lifecycle
A finding moves between four states depending on its check result. This is the heart of the product.
| State | Meaning |
|---|---|
| present | The vulnerability is open. Initial state on import. |
| remediated | The check passed: the fix is verified. |
| regressed | A previously fixed finding whose check fails again. |
| inconclusive | The check could not run: unreachable target, network error. Temporary, draws no conclusion. |
            check PASS                    check FAIL
present ──────────────► remediated ──────────────► regressed
   ▲                                                    │
   └──────────────────── check PASS ───────────────────┘

any state ── check ERROR ──► inconclusive
inconclusive never counts as a regression. A target
under maintenance does not raise an alert.
Getting started
The shortest path from a pentest report to your first automatic check is four steps.
- Create a scope for the audit or application concerned.
- Import your findings from a CSV, JSON or YAML file.
- Attach a check to each finding you want watched. You do not have to cover them all: start with the critical ones.
- Schedule the replay, then let it run.
The built-in check editor runs a check live against its target before you attach it, and shows the result assertion by assertion. Use it: a check never run by hand is a check that will alert for nothing.
Importing findings
Three formats are accepted: CSV, JSON and YAML. Whatever the format, three fields are mandatory.
| Field | Required | Detail |
|---|---|---|
| ref | yes | Your internal reference, the one from the pentest report. |
| title | yes | Vulnerability name. A row without a title is rejected. |
| severity | yes | critical, high, medium, low or info. |
| description | no | Free text, typically the observation and the expected remediation. |
| asset_kind | no | Target nature, for example host or endpoint. |
| asset_value | no | The target itself: hostname, URL, endpoint. |
| source | no | Where the finding came from. Useful to trace it back to an audit. |
| cwe, owasp | no | Frameworks. Common column names from market tools are recognised. |
A minimal CSV looks like this:
ref,title,severity,asset_kind,asset_value,cwe,owasp
PT-2026-014,SQL injection on /api/orders,critical,endpoint,POST /api/orders,CWE-89,A03
PT-2026-015,Missing HSTS header,low,host,www.example.com,CWE-319,A05
In JSON, the same thing reads:
{
  "source": "audit-2026-04",
  "findings": [
    {
      "ref": "PT-2026-014",
      "title": "SQL injection on /api/orders",
      "severity": "critical",
      "description": "order_id parameter concatenated into the query.",
      "asset": { "kind": "endpoint", "value": "POST /api/orders" }
    }
  ]
}medium
and a warning is raised. A CSV missing ref,
title or severity, on the other hand, is
rejected outright, before any processing.
Writing a check
A check is described in YAML. It aims at a target, runs a request, then evaluates a list of assertions. The check passes if every assertion passes.
name: "SQL injection fixed on /api/orders"
type: http_probe
target: "https://app.example.com/api/orders?order_id=1'"
method: GET
severity: critical
assertions:
  - field: status_code
    operator: eq
    value: 400
  - field: body
    operator: not_contains
    value: "SQL syntax"
tags: [sqli, owasp-a03]
The reasoning is inverted compared to a scanner: you write what must be true once the flaw is fixed. Here, the application must reject the input and never leak an SQL error. The day either stops being true, the finding moves to regressed.
Two detection modes
The editor's DETECTION selector decides what your
assertions describe. It is the most structural setting on a check,
and the easiest one to get backwards.
| Mode | Your assertions describe… |
|---|---|
| Normal | the remediated state. The check passes when they hold. This is the default, and the mode used in the example above. |
| Signature | the vulnerable pattern. The check passes when they no longer hold. Handy when the flaw is easier to describe than its fix. |
Available operators
| Family | Operators |
|---|---|
| Equality | eq, neq, in, not_in |
| Text | contains, not_contains |
| Regular expression | matches, matches_regex, not_matches_regex |
| Comparison | gt, lt, gte, lte |
| Presence | exists, not_exists |
| URL | eq_url, neq_url - compare URLs while ignoring insignificant differences |
Several checks can be chained in one document by separating them
with ---.
Good practice
- Do not follow redirects without a reason.
follow_redirectsdefaults tofalseon purpose: turn it on and astatus_code eq 301assertion will never see the 301, hidden by the follow. - Prefer
inovereqfor status codes. A 401 and a 403 both mean "not allowed". Testingin [401, 403]avoids a false regression the day the application changes its code. - Always pair it with a body assertion. A
200proves nothing if the page still returns the error trace. Add abody not_containson the revealing string. - For a decommissioned target use
expect_unreachable: truerather than letting the check error out. Without it, removing the DNS record produces repeatedinconclusiveresults instead of a clean pass. - Keep the timeout between 5 and 15 seconds. Beyond that the check ties up the scheduler without learning anything more.
- Five to seven assertions per check, no more. Past that, split them: when the check fails you want to know which of the two problems came back.
- Do not forget authentication. On a protected endpoint, a check with no auth profile returns 401 forever - a pass or a fail that means nothing.
contains looks for a literal
substring, matches_regex interprets a regular
expression: contains: "v1.0" does not behave like
matches_regex: "v\d+". And while HTTP headers are
case-insensitive on the wire, the header.Content-Type
field is case-sensitive in configuration: write the canonical form.
When a check fails for no obvious reason
- Replay it live from the editor and read the result assertion by assertion: the detail says which one failed.
- An empty observed value means the target did not answer. That is a case for
expect_unreachable, not for a looser assertion. - A rejected regular expression was refused by the anti-ReDoS guard. A pattern like
(a+)+is turned down: simplify it. - A result in error rather than pass or fail comes from transport - timeout, TLS, DNS - not from your assertions.
Check types
The five types below cover the vast majority of remediations in an application pentest report.
| Type | What it does |
|---|---|
| http_probe | Sends an HTTP request, then tests the status code, the body and the headers. |
| dns_resolve | Resolves a name and checks that it points somewhere, or precisely that it no longer does. |
| tls_inspect | Opens a TLS session and checks the negotiated protocol. Useful to confirm a weak version really was disabled. |
| port_scan | Attempts a TCP connection and checks whether a port is open or closed. |
| header_check | Checks the presence, absence or value of a security header. |
The engine exposes more specialised ones, notably
cert_expiry, ssh_audit,
spf_check, dmarc_check,
dkim_check, cors_check,
jwt_probe, smtp_check,
ldap_check, snmp_check and
http_chain for multi-request scenarios.
Payload replay
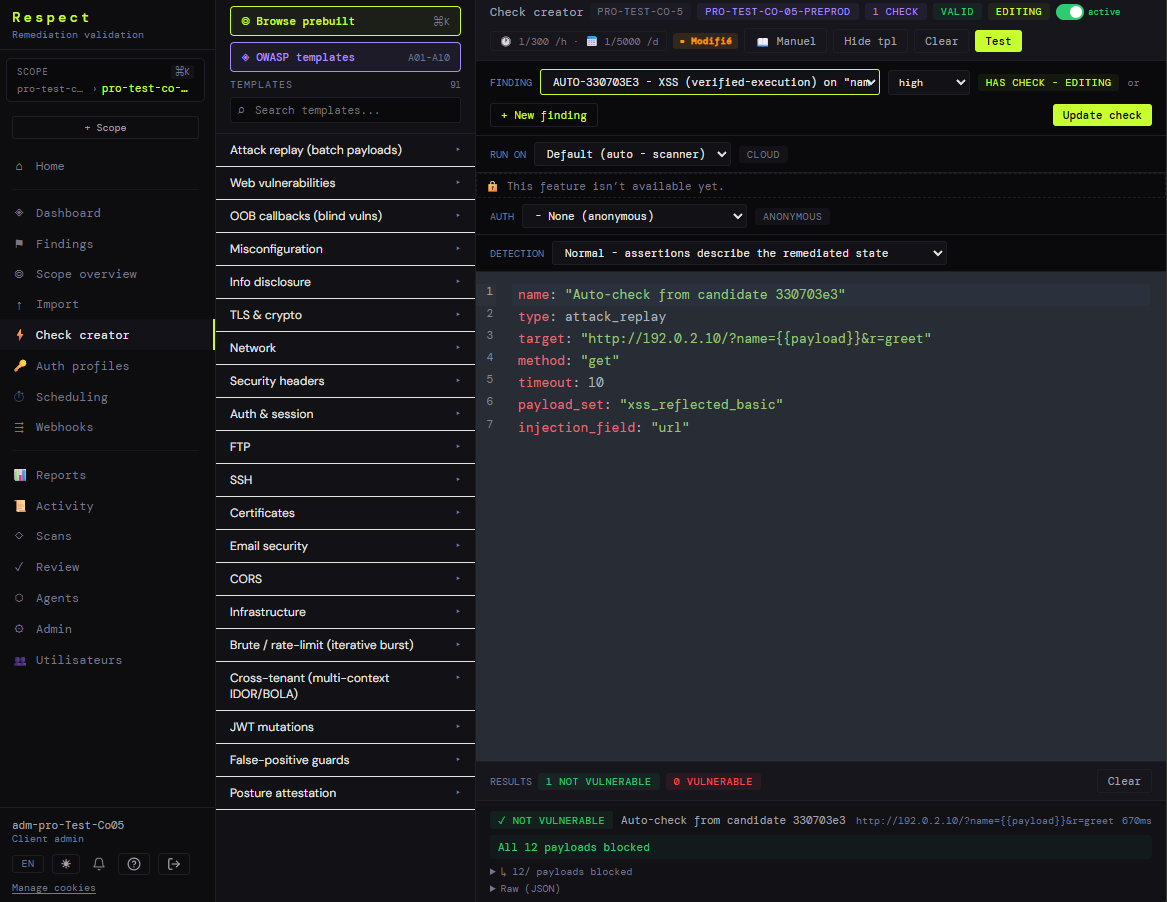
The attack_replay type does not test one request but a
whole payload set. You name a payload_set and the field
to inject it into, and the engine replays them all.
name: "Reflected XSS fixed on /?name="
type: attack_replay
target: "https://demo.example.com/?name={{payload}}&r=greet"
method: "get"
timeout: 10
payload_set: "xss_reflected_basic"
injection_field: "url"
The result is global: 12 of 12 payloads blocked is a pass, a single one getting through is a fail. This is the right tool when the remediation is a filter - output encoding, a web application firewall, input validation - rather than a one-off fix.
Ready-made templates
The editor ships a library of 91 templates grouped by family: web vulnerabilities, payload replay, out-of-band callbacks for blind flaws, misconfiguration, information disclosure, TLS and crypto, network, security headers, auth and session, FTP, SSH, certificates, email security, CORS, infrastructure, brute force and rate limiting, multi-context IDOR and BOLA, JWT mutations, false-positive guards, posture attestation. A dedicated entry filters them by OWASP Top 10 category.
NOT VULNERABLE or VULNERABLE because it
reasons about the target; the run history counts
PASS, FAIL and ERR because it
reasons about the check. NOT VULNERABLE and
PASS mean the same thing, as do
VULNERABLE and FAIL.
Scheduling
Scheduling is set per scope, not per finding: every check in a perimeter is replayed together, which gives a coherent picture at a given date. A scope can be paused and resumed without losing its history.
Pick the frequency from how often the watched application ships, not from finding severity. An application released every week deserves a daily replay: it is deployment that breaks fixes, not the passage of time.
A run can also be triggered by hand with Run now,
without touching the schedule. Useful right after a deployment whose
effect you want to check immediately rather than waiting for the
next pass.
Reports and coverage
Every scope produces a PDF report covering the posture, the findings and their state. That is the deliverable to attach to a security committee pack or send back to an audit client.
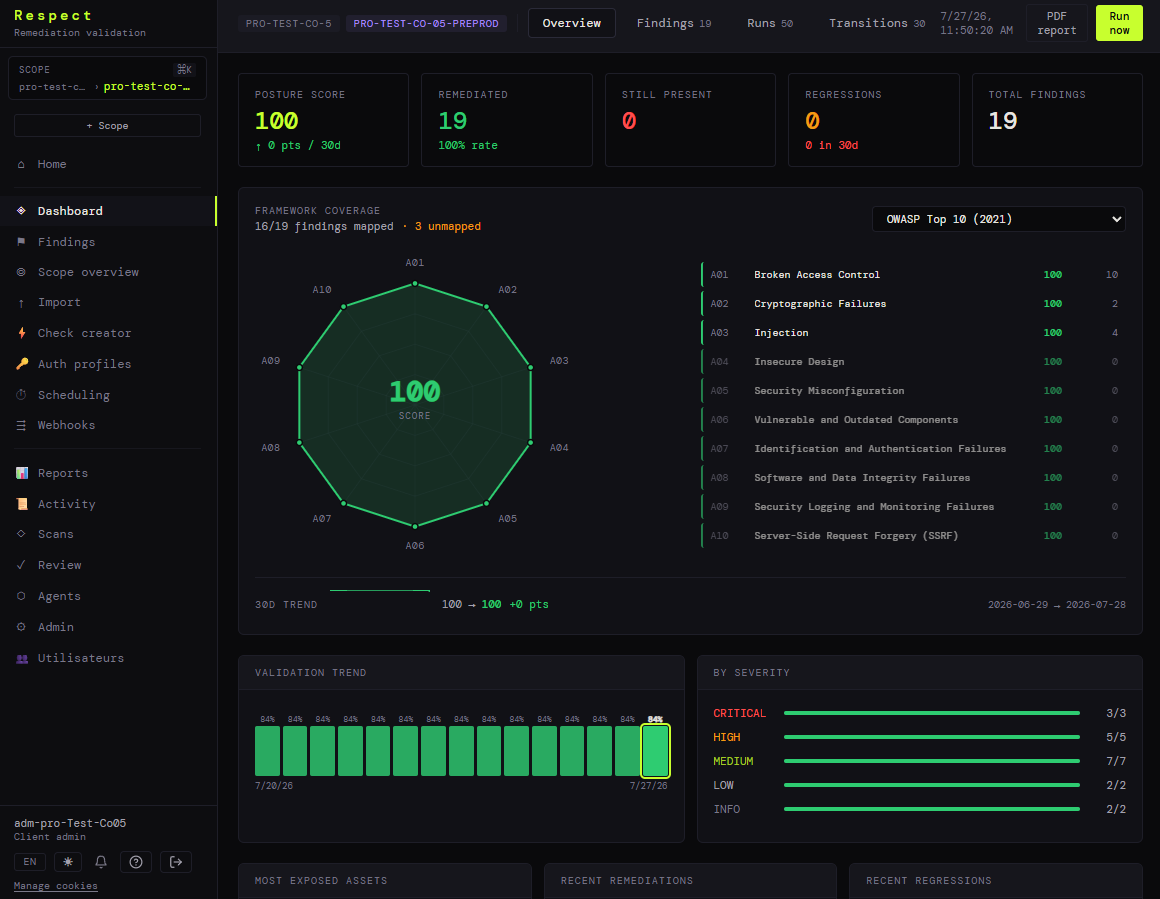
The dashboard also shows framework coverage: your findings are mapped to OWASP Top 10 categories, with a score per category and a count of the ones mapped to nothing. Those are worth a look - an unmapped finding is often a finding poorly described at import time.
Alerts
A transition to regressed raises an alert by email
and by webhook. The webhook lets you route the information to your
team chat, your SIEM or your ticketing tool.
Only regressions alert. A finding that stays open produces no
daily noise, and an inconclusive check does not alert
either.
Posture score
The score summarises a scope's exposure on a 0 to 100 scale, weighted by severity.
score = 100 × (1 − open_exposure / total_exposure)| Severity | Weight |
|---|---|
| critical | 10 |
| high | 6 |
| medium | 3 |
| low | 1 |
| info | 0.2 |
All findings remediated gives a score of 100. The weighting means one open critical costs as much as ten low findings: the score cannot be inflated by fixing trivia.
Roles
| Role | Reach |
|---|---|
| client_admin | Administers their organisation: scopes, findings, checks, users. |
| check_creator | Writes and edits checks, without touching administration. |
| analyst | Reads findings, runs and posture. No modification. |
| mssp_admin | Service provider managing several client organisations. |
A question this page does not cover?
The documentation follows the product, which moves fast. If something is missing or looks wrong, say so: it is the fastest way to get it fixed.
Write to us